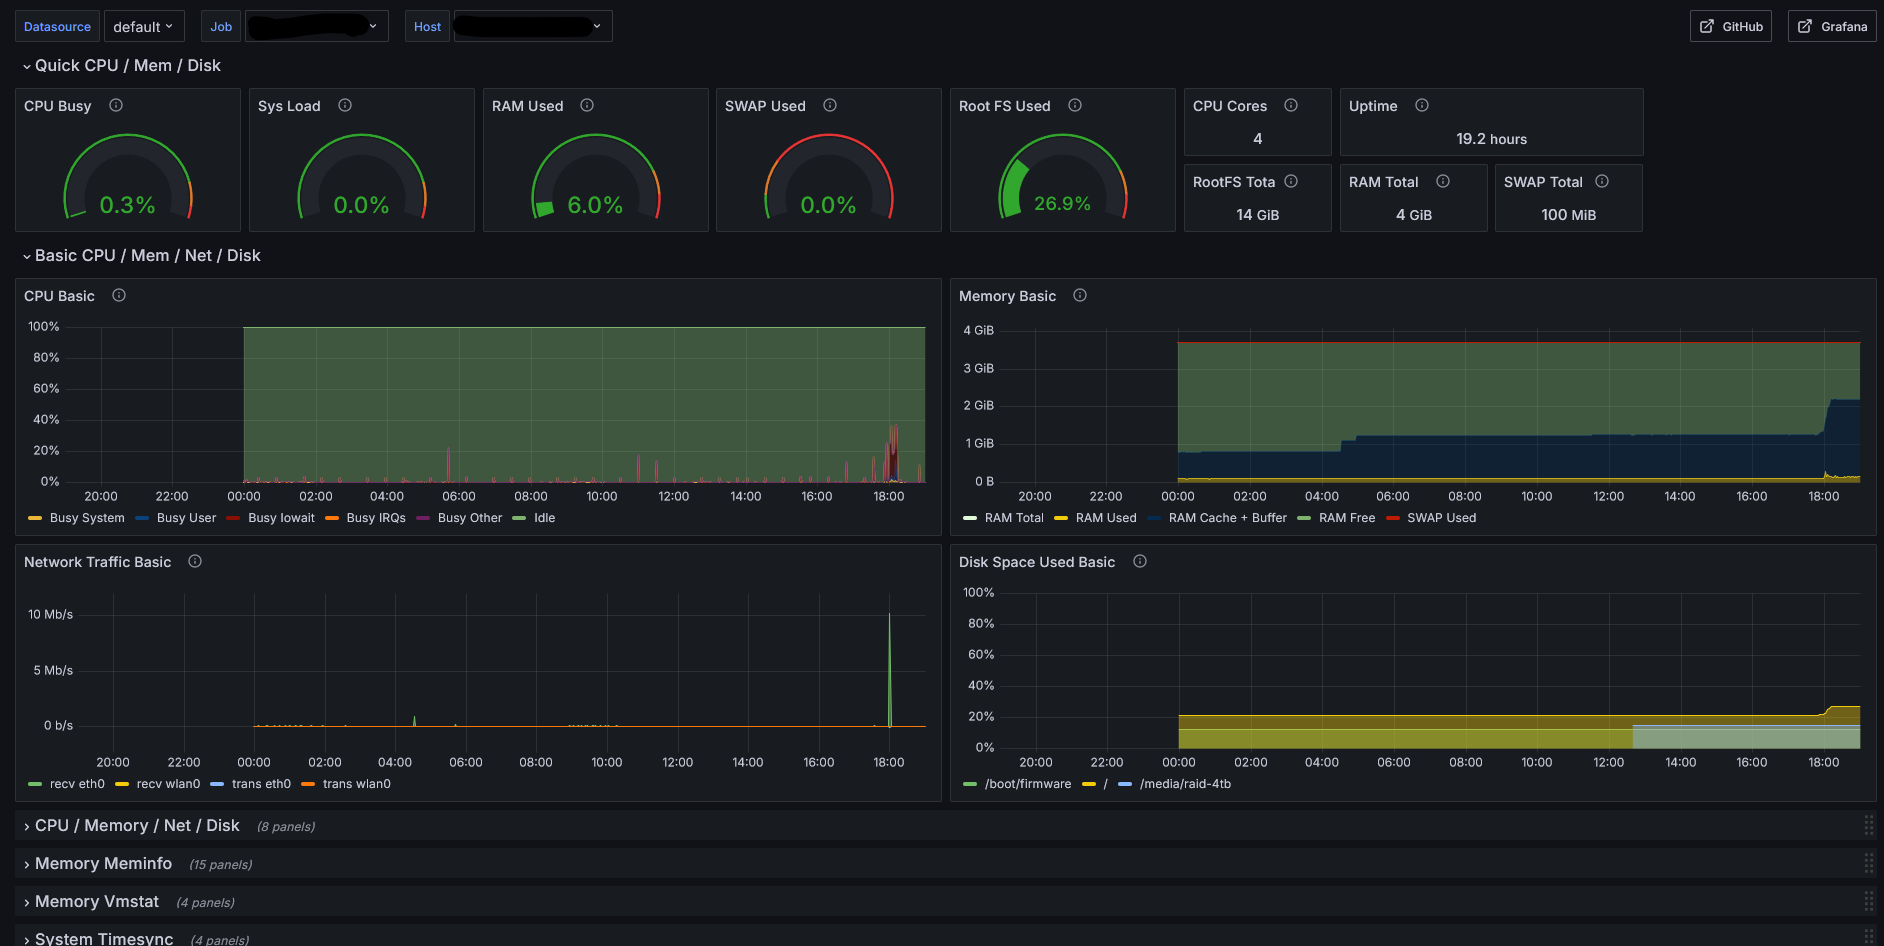
Do you want to monitor disk, CPU, memory and network throughput for your Raspberry? A nice way to do gather these metrics is using Prometheus, and visualize the data with Grafana. With Grafana, you can also set up alerts when the disk space runs low or the network traffic is too high for too long.
To set up monitoring, you need to have an endpoint for a Prometheus server to scrape metrics from (there are many ways to go about that, for example like this. A handy tool to expose metrics for your server comes pre-packaged in many modern Linux distros, for example the Bookworm release of Debian/Raspberry Pi OS. To set up a metrics endpoint for your Raspberry Pi, simply run the following command:
sudo apt-get install prometheus-node-exporter
This will set up a prometheus scrape endpoint at port 9100 under /metrics. You can try it out with curl (if this fails, read on):
curl "http://localhost:9100/metrics"
You will also have a new service that runs automatically whenever you boot up the server:
sudo systemctl status prometheus-node-exporter
If for some reason if isn’t enabled by default, enable it and start it like this:
sudo systemctl enable prometheus-node-exporter
sudo systemctl start prometheus-node-exporter
If you are using external storage, for example via USB, chances are you have mounted the device to /mnt or /media. If you do, the devices, such as /dev/sda1 or /dev/sdb1 will be excluded from monitoring. This is simply because of the following default argument for the prometheus-node-exporter:
--collector.filesystem.mount-points-exclude="^/(dev|proc|run|sys|mnt|media|var/lib/docker/.+)($|/)"
You have two options: either mount your device to a directory that won’t be excluded by the default setting, or override the default setting. To override, you need to edit the file “/etc/default/prometheus-node-exporter”.
sudo vi /etc/default/prometheus-node-exporter
Say you want to monitor /dev/sda1 mounted under the /media directory, simply remove the directory from the regexp above, and add it as a custom argument. The file should have the following contents:
ARGS="--collector.filesystem.mount-points-exclude="^/(dev|proc|run|sys|mnt|var/lib/docker/.+)($|/)""
Now restart the prometheus node exporter:
sudo systemctl restart prometheus-node-exporter
And you may check that your disk is not part of the metrics:
curl "http://localhost:9100/metrics" |grep bytes |grep sda
You should now se metrics available for the disk.
Ïn order to store the data in a Prometheus database, you need to install Prometheus, and add a scrape config for your server:
scrape_configs:
  - job_name: 'yourservername'
    static_configs:
      - targets:
        - yourserverip:9100
    metrics_path: /metrics
    scrape_interval: 60s
To get started with a Grafana dashboard for your server, I recommend using the pre-built Prometheus node exporter dashboard: Pre-built Grafana dashboard for Prometheus Node Exporter
It is like this, with lots of sections beneath with pre-filled graphs for everything imaginable.

