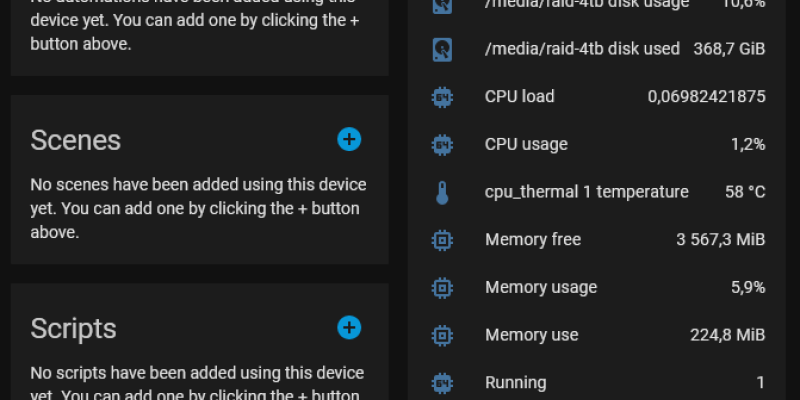
There are so many tips for monitoring your servers or raspberries through Home Assistant. Some involve Prometheus and the Grafana Add-on, some involve the RPi Reporter MQTT2HA Daemon, and others suggest Glances in various flavors.
Pick the easy (although maybe bloated) way out - and just install G...
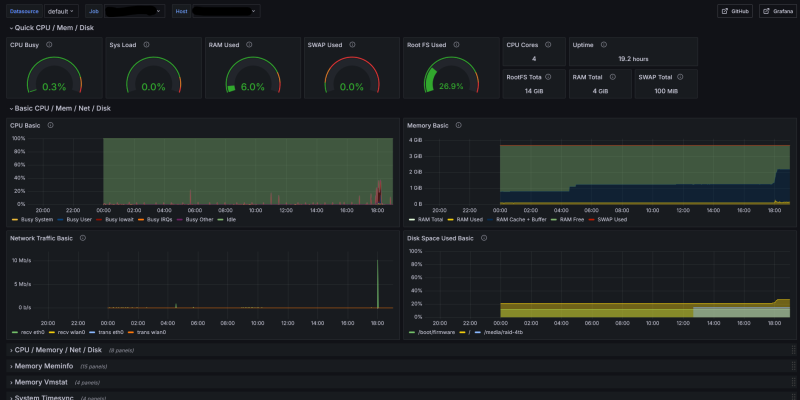
Do you want to monitor disk, CPU, memory and network throughput for your Raspberry? A nice way to do gather these metrics is using Prometheus, and visualize the data with Grafana. With Grafana, you can also set up alerts when the disk space runs low or the network traffic is too high for too long.
...