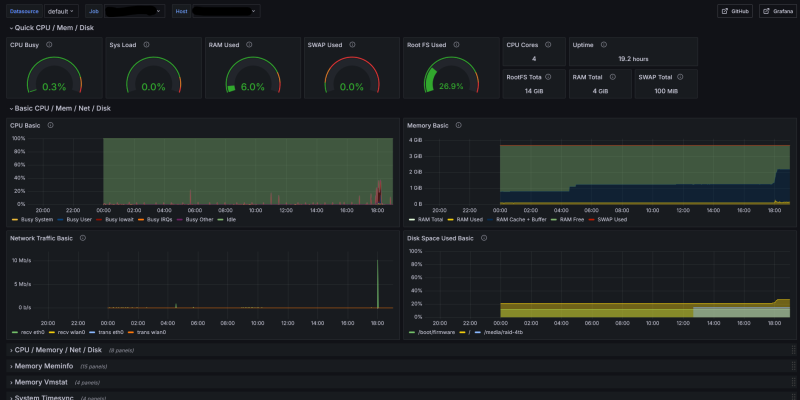
Do you want to monitor disk, CPU, memory and network throughput for your Raspberry? A nice way to do gather these metrics is using Prometheus, and visualize the data with Grafana. With Grafana, you can also set up alerts when the disk space runs low or the network traffic is too high for too long.
...
Have you ever dreamt of having smooth looking dashboards showing you the status of your servers in real time? Look no further! Grafana and Prometheus are really awesome at exactly that! Plus, you get alerting whenever any parameter you define stray outside acceptable limits. And the really great new...
I've spent some time making this work. I've tried so many different paths, I don't even remember where I started. The current solution, though, is available for you on The Awesome Garage GitHub account.
Here I'll just put down the basics, and you can look into the details in the docker-composer....